Using Satellite Imagery To Measure Damaged Crop Areas

With much of the upper Midwest receiving excess rainfall in June and early July, a few customers have asked us to help them use imagery to identify and measure the area affected by this water damage. Following the steps below, this can easily be done from within the John Deere Operations Center.

Please note that this assumes the poorest parts of the field are from water damage. We have no way to differentiate water damage from other crop damage, so it is still best to scout fields in person. However, this is a quick and easy way to get an idea of where to go and the extent of the damage.

Also, the steps below will show how to do it on the website, but it works the same way if you want to do it on the John Deere Operations Center mobile app.

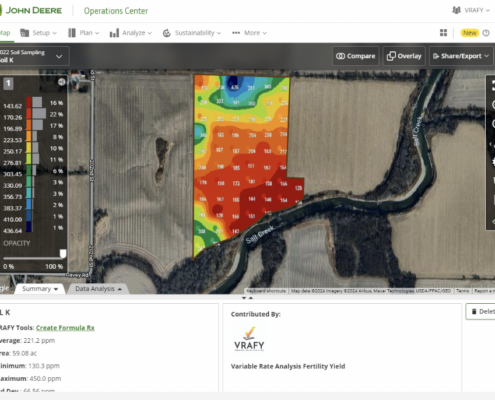
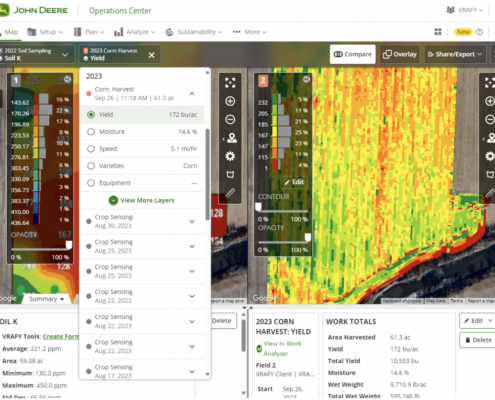
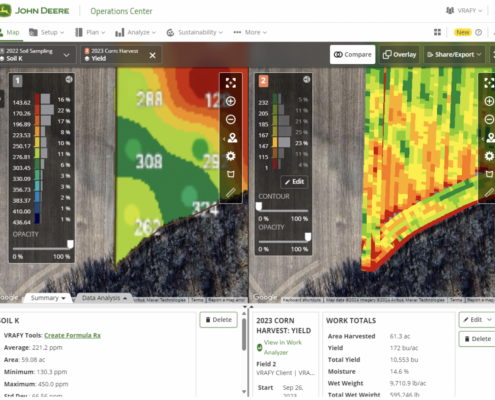
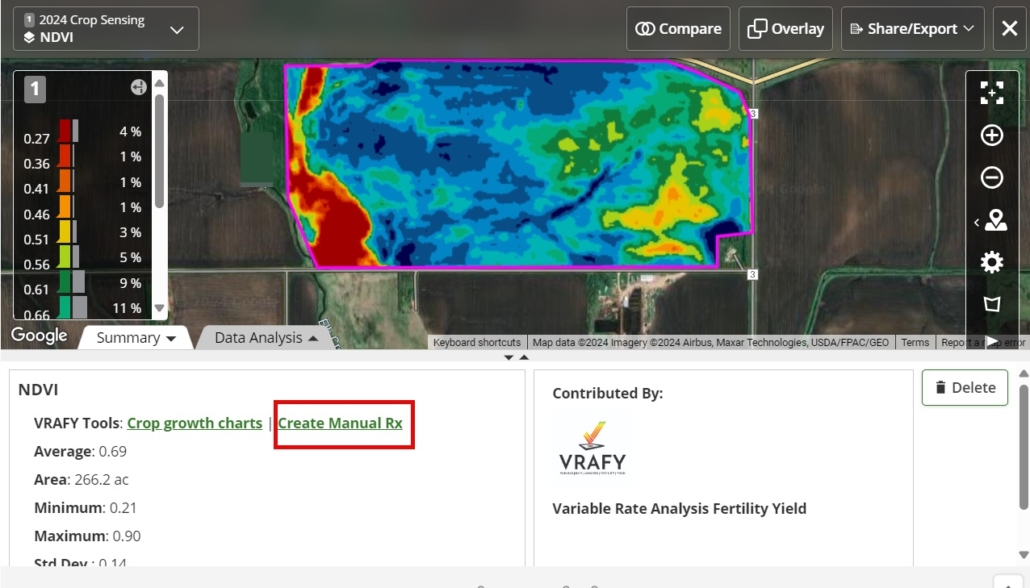
  • Start by bringing up an imagery layer using the Field Analyzer Tool within the Operations Center. It will be labeled as “Crop Sensing” in the drop-down.  NDVI works for most customers for this, but feel free to check out the other imagery layer types to see if one better matches your fields.  Note: When viewing the layer, it will show the percentage of the field in each gradient. When looking for damaged areas on an NDVI image, the lowest values (typically red), will indicate where the crop damage has occurred. To calculate the acres, we will use the VRAFY prescription tool to tell us the acres for each colored part of the field.
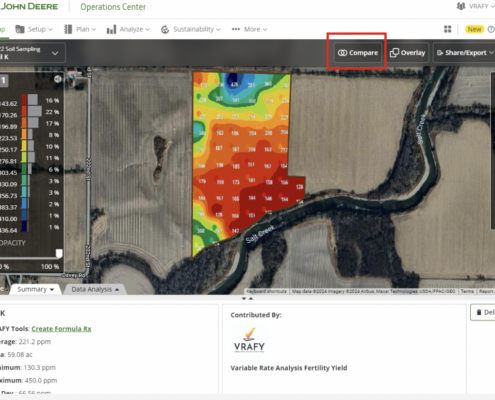
  • Under the map, locate and click on the Create Manual Rx button.
  • In the new window, under the Classify Settings, change the Zone Type to “Colour Breaks”, then click Run Rx.
  • You will now see an acres total for each of the Color Breaks on the map. You can repeat this quickly across all of your fields. If you close out the window here, it will not save the prescription.
  • As a bonus, you can save this as a prescription for later use if you add a Product and Rates. For example, if you want to skip fungicide applications where the crop has drowned out, set the lowest colored zone(s) to zero. Then set the rest to your standard rate. Press Save Shapefile at the bottom, and you will have just created a quick and easy variable rate Fungicide Map!
  • Here is the view in the Operations Center of the previous map as a Fungicide Prescription. I set the water-damaged spots to zero and the rest to my standard rate of 10 GPA.

Using satellite imagery from VRAFY in the John Deere Operations Center makes it quick and easy to determine the extent of crop damage after a major event, like the recent flooding. If you have any questions, feel free to reach out to VRAFY support at 507-800-0898 or click here to schedule a meeting with one of our awesome team members!

July 2024 Updates

You might have noticed our updated pricing and the enhanced features at each level. We’ve made some exciting changes, such as the ability to collect soil samples and view soil test results in the $1 VRAFY Basic level. We’ve also reduced the price of the VRAFY Complete level to $4 per acre. Click here to learn more.


We also added a new knowledge base to our website with quick how-tos for some of the common tasks you may need to do within the John Deere Operations Center and VRAFY. This user-friendly resource is easily accessible by clicking Knowledge Base at the top of our website. It is just a start, but we will continually be adding content. Be sure to check it out!


We are excited to tell you about our new support scheduling tool! It allows you to schedule time with an agronomist or technology specialist on your schedule, respecting your time and availability. You can schedule a phone call or a video chat, and even share your screen during the video chat to make support easier.

We’re pleased to welcome Justin Childears as a Regional Sales Manager located in Nebraska. Justin has been involved professionally and personally in production agriculture for his entire career with a focus on precision agriculture for almost 20 years. He’s looking forward to learning more about the needs and desires of producers in the western high plains and beyond while expanding the reach of VRAFY’s solution offering.

Come see us at these upcoming events! Mention that you are an existing customer & receive a FREE gift!​
Ag PhD Field Day in Baltic, SD – July 25​ | AgroExpo in St. Johns, MI – August 13 & 14​ | DakotaFest in Mitchell, SD – August 20-22

Nitrogen Management in a Wet Year

Southeast, South Dakota, along with the majority of the Midwest region of the United States, has seen substantial amounts of rain the past couple of weeks. Crop health, flooding issues, and fertility are a few of the things to worry about when dealing with these big rain events. As the rain passes and fields begin to dry out, you should take some time to drive around and assess the current conditions you are up against.

Washouts, sitting water, and flooding are many of the common issues that have followed this previous rain event. When thinking about fertility, it is important to understand the leachable nutrients. Rightfully so, nitrogen is a commonly talked about nutrient when referring to leachability. To know how much you have, taking nitrate samples is something to consider. Of course, there may be acres on every farm that yield zero, but it is important to not give up on the acres that still have a chance to yield high.

Depending on your soil type, nitrate moves six inches down the profile for every inch of drainage. In some places, we have gotten ten inches of rain or more. With this rule, it is safe to assume that nitrate has moved sixty inches down into the soil profile. V8 corn is commonly referred to as about 24 inches. This means that with this recent rainfall, we lost a good amount of nitrogen. It is understandable to be stressed and discouraged by the current situation, but staying positive in a tough situation is the most important thing to do. We highly encourage you to spend a couple of bucks and sample your fields to see how you are sitting on nitrate levels going forward this growing season.

Create Variable Rate Prescriptions Using Satellite Imagery

Use in-season data from your fields to create variable rate maps in ‘almost’ real-time. Satellite imagery maps can show recent vegetative maps of your fields, highlighting areas with higher and lower plant health. VRAFY brings this information to you on Operations Center Web and Mobile. What you do with this information is up to you.

Early in the growing season, satellite imagery picks up the color of the soil between crop rows for the most part. With early growth stage crops (V1-V3), a vegetative index of your field may show areas of high plant health, but make sure to scout as some of this vegetation could be weeds.

If you have specific disease concerns, like Sclerotinia White Mold, you may consider creating a variable rate map to target those historically bad areas. White Mold control requires lots of management, and variable rate can help you target specific areas that need fungicides.

As the growing season continues, you may also want to utilize a vegetative map to help you capture top-end yield in areas of your field that are looking promising. If you had plans to top-dress a flat rate of Nitrogen on a corn crop, you can now target the healthiest areas of the field and add an extra 20 pounds with ease!

Optimizing Phosphorus Management

As farmers navigate the challenges of tighter margins, efficient fertilizer management has become more crucial than ever. When growing corn and soybeans, phosphorus costs can significantly impact your bottom line. Let’s explore how to make every dollar count.


Crop Removal Approach: A Smart Choice

Even without soil tests, research suggests that the Crop Removal method is an economical way to manage phosphorus. Here’s how it works:

  • Estimate the amount of phosphorus removed from the field through grain harvest.
  • Replace that phosphorus using variable-rate fertilizer application.


The University of Nebraska-Lincoln Study

In a comprehensive 15-year study, researchers at the University of Nebraska-Lincoln examined three phosphorus application methods for corn:

  1. Crop Removal Only: Focused on replacing phosphorus based on crop removal.
  2. Build Program: Targeted different soil levels of 15, 30 and 45 ppm
  3. Deficiency Correction Program: Build to a target level, then apply crop removal. Reduce crop removal in high soil test areas.


Key Findings

  • Crop Removal emerged as the most cost-effective strategy over the study period.
  • A secondary finding identified a need to reduce applications when soil test levels are higher than 40 ppm (as measured by soil Bray P1 test).


Crop Removal Recommendations with VRAFY

Sign up for VRAFY today to access crop removal recommendations for phosphorus. Using yield maps, we can automatically generate prescriptions for as little as $1 per acre. No advanced skills required—just provide your yield data and fertilizer preferences.

Remember: Sometimes less is more, especially when it comes to phosphorus management.


Source: https://acsess.onlinelibrary.wiley.com/doi/10.2136/sssaj2018.02.0068

Scouting Using Soil Data

Do you have spots in your fields that historically yield low? Taking soil samples and properly interpreting the data can benefit you drastically. When it comes to soil sampling the number one thing you want to do is get your nutrients in balance. In situations where you own the ground, building up your soil fertility levels is the best investment for long-term yield gains, soil health, and environmental benefits.

VRAFY is a great tool to set up soil sampling maps. With our competitive prices at just $1/ac for VRAFY Basic, it is a no-brainer to use our technology to set up the best soil sampling map for your operation. You can set your grid points running from North to South, East to West, etc. This allows you to go with your rows, which is the recommended way to pull your samples. The two main forms of soil sampling are grid maps and zone maps. VRAFY has both options readily available for whatever you prefer on your farm.

In your low-yield areas, you can sample these spots using the grid or zone maps created by VRAFY. In doing this, you can get your results back and make a variable rate fertility program that will help solve the fertility issues in those areas. Along with this, you will be able to drive out to those points throughout the growing season and scout those areas. You will be able to tell you if you are deficient based on the leaves. Different nutrient deficiencies show a different reaction in the plant. With VRAFY, you can maximize your time spent scouting by focusing on bad areas of your fields by using the GPS through Ops Center. Consult with your local VRAFY dealer to set up your soil sampling plan today.

How To View Data Side by Side in John Deere Operations Center

One of the benefits of having your data in the Operations Center is that it becomes easier to view the layers side by side. This allows you to see how the decisions you made throughout the year impacted the results on the yield map. It also allows you to see how the soil test results compare to the yield results in your field. You will see how easy it is to compare your yield map to your soil test results in a few steps.

For additional details for each step, check out our Knowledge Base.

  1. Start by bringing up a” Soil Test Results” layer within the Field Analyzer tool on the Operations Center website. This tool currently does not exist in the mobile app.If you do not have soil test results in your Operations Center, please contact VRAFY so we can discuss how to add them to your Operations Center Account.
  2. Next, click on the “Compare” button in the upper right.
  3. At this point, a second drop-down list will appear where you can choose your second layer. For example, we will compare the “Yield Layer” for Corn in 2023 against our soil sampling results.
  4. Once you view your layer, you can zoom in and out or move around the field, and both maps will stay coordinated. Our example shows that the soil K (Potassium) has been accumulating in the southern areas. Over the years, uniform application rates were used across the entire field. This practice inadvertently led to an excess buildup of potassium in this part of the field.

Comparing layers side by side is quite easy in the Operations Center and can help you visualize relationships between multiple factors and how they impact your yield.

If you do not have your soil test results or satellite imagery in the John Deere Operations Center, sign up with VRAFY today to get them added!

How To Do a Pre-Sidedress Nitrate Test

The Pre-Sidedress Soil Nitrate Test (PSNT) is a valuable tool you can use to optimize nitrogen fertilizer use in grain corn and corn silage production. Here is why collecting a PSNT is an important part of a nitrogen management plan:

  1. Nitrogen Optimization: The PSNT measures the amount of nitrate-nitrogen available in the soil when the corn is between 6-12 inches tall. This timing, combined with the crop’s rapid growth rate, allows time to adjust before the nitrogen gets to critically low levels.
  2. Cost Savings: If the PSNT indicates sufficient nitrogen levels, growers can skip additional applications, saving time and money. Conversely, if you can identify nitrogen deficiencies early enough, there is still enough time to address them to avoid serious yield loss.
  3. Previous Crops and Practices: Cover crops (both as a potential source and tie-up as they break down), manure, and previous legume crops are examples of why it is important to understand how these have impacted the overall nitrogen levels in your soil.

A PSNT is low-cost, especially compared to the expense of nitrogen and the potential yield loss from insufficient nitrogen. It is easy to collect, following the steps below.

  1. What to Bring: Head to the field with a soil probe, clean bucket, soil sampling bags, and marker.
  2. When to Go: About one week before side dressing. Ideally, it would be at least 3 days after any heavy rains, and without heavy rains in the forecast that could cause further nitrogen losses.
  3. What to Collect: Use your probe to collect 12-inch cores. Pull a core in the row, then every 3 inches as you move across to the next row. Repeat until you have 15-20 total cores in your sample. Collect at least one sample per field. It is recommended to pull the sample at 12 inches. You can even go as deep as 24 inches to determine how your nitrogen is moving through the soil profile.
  4. After Collecting: Label your soil sample bag with the required information on the bag. Mix the cores thoroughly and place them in the sample bag. After collecting, do not leave the samples in your vehicle. Keep them cool, or even better yet, freeze them, as hot temperatures can affect the readings. Fill out the lab submission sheet and send the samples to the lab ASAP.

Most labs will get your results back to you within 24 hours after they have received it. Many will offer recommendations based on the results if you provide a crop and yield goal on the soil test submission sheet. The general rule of thumb is that if the PSNT results are 25 or higher, there is a low probability of economic return from additional nitrogen. If the results are below 20, there is a good chance you will get a positive return on your investment by applying additional nitrogen. You can also contact your local extension office, as many have nitrogen return calculators specific to your state.

The Pre-Sidedress Soil Nitrate Test is one tool for understanding the fertility of your fields. If you combine that with management zones from VRAFY and regular soil testing, you have a powerful nutrient management tool to understand the complete fertilizer picture of your operation.

Benefits of Variable Rate Applications

One of the main focuses of fertility is avoiding the over-application of fertilizer leading to runoff into rural water systems like streams and rivers. Along with avoiding over-application, variable rate fertilizer applications have led to increased soil health while also increasing yield. By knowing where and how much to apply in each spot of your field, you will not only be able to save a lot more time for other projects on the farm, but you will also be saving money.

A benefit to variable rate applications would be high yield areas vs low yield areas. Every farmer knows of a few places in their crop production land where yield is just not as high as they would like it to be, whereas in other spots the yield is outstanding. With precision agriculture and variable rate applications, you can apply less or more nutrients to these spots depending on your needs. This can significantly cut back on fertilizer input leading to saving money and driving yield in those low yield areas.

Here at VRAFY, one of our goals is to help you improve yields and spend your fertilizer dollars more effectively. Depending on the soil sample and yield data you provide, VRAFY can produce variable rate fertility maps for most nutrients you may need to apply. These maps will be in a universal format and VRAFY can help you load them in your controller or share them with your custom applicator.

What’s New with VRAFY!

VRAFY, your trusted partner in precision agriculture, has been serving growers and dealers for over a year. As we continue to evolve, we are committed to enhancing value and empowering our growers. In this exciting update, we are thrilled to announce changes that will benefit you!

What’s New?

  • Price Drop: We are excited to announce a $1 reduction in VRAFY Complete pricing. Now, it’s only $4 per acre!
  • Soil Data Integration: We recognize the immense value of soil information. Starting immediately, VRAFY Basic now includes soil data capabilities.


1. VRAFY Basic: Visualize Your Data

What’s Included?

  • Upload Existing Soil Sampling Data: Seamlessly import your historical soil data.
  • View Soil Sample Data in the Operations Center: Visualize soil test results and spot trends.
  • Build Soil Sampling Plans: Create targeted sampling strategies.
  • Collect Your Own Soil Samples: Take control of your field sampling if you prefer to do it.
  • Satellite Imagery: VRAFY Basic still offers satellite imagery within the Operations Center.
    • Scout from Imagery: Identify issues and make informed decisions.
    • Create Prescriptions: Generate prescriptions from imagery for seeding, fungicide, or fertilizer.
  • Crop Removal Fertilizer Prescriptions: Automatically generate variable rate fertilizer recommendations from yield maps.
  • Affordable Pricing: VRAFY Basic remains at just $1 per acre.


2. VRAFY Plus: Empowering Growers

What’s Included?

  • Run Your Own Prescriptions: With VRAFY Plus, you are in the driver’s seat.
  • Formula Flexibility: Choose from a growing library of formulas (over 100 available).
  • Customize and Adjust: Fine-tune prescriptions to match your unique needs.
  • Visualize Prescriptions: See your prescriptions in the Operations Center before you send them to the field.
  • Soil Point to Yield Analysis: At season’s end, assess how soil test results correlate with actual yields.
  • Affordable Pricing: VRAFY Plus remains at just $2 per acre.


3. VRAFY Complete: Unleashing Agronomic Expertise

What’s Included?

  • Expert Guidance: Our agronomists are here to assist you:
  • Custom Prescription Support: We have you covered whether you need custom prescriptions or apply unique fertilizer blends.
  • Full Nutrient Management: Leverage our expertise for a comprehensive plan.
  • Management Zone Creation: We collaborate with you to develop soil sampling, seeding, and fertility management zones.


At VRAFY, we are committed to your success. These updates reflect our dedication to providing exceptional value. Join us as we empower growers, enhance services, and cultivate stronger partnerships.