by bburgeson
Share

With much of the upper Midwest receiving excess rainfall in June and early July, a few customers have asked us to help them use imagery to identify and measure the area affected by this water damage. Following the steps below, this can easily be done from within the John Deere Operations Center.
Please note that this assumes the poorest parts of the field are from water damage. We have no way to differentiate water damage from other crop damage, so it is still best to scout fields in person. However, this is a quick and easy way to get an idea of where to go and the extent of the damage.
Also, the steps below will show how to do it on the website, but it works the same way if you want to do it on the John Deere Operations Center mobile app.
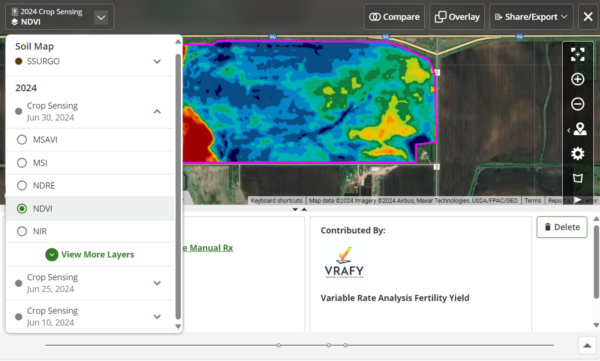
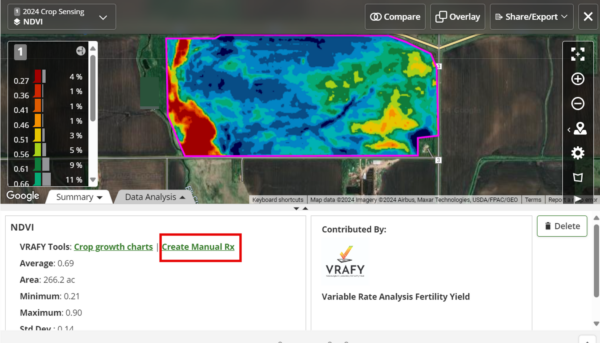
- Start by bringing up an imagery layer using the Field Analyzer Tool within the Operations Center. It will be labeled as “Crop Sensing” in the drop-down. NDVI works for most customers for this, but feel free to check out the other imagery layer types to see if one better matches your fields. Note: When viewing the layer, it will show the percentage of the field in each gradient. When looking for damaged areas on an NDVI image, the lowest values (typically red), will indicate where the crop damage has occurred. To calculate the acres, we will use the VRAFY prescription tool to tell us the acres for each colored part of the field.
- Under the map, locate and click on the Create Manual Rx button.
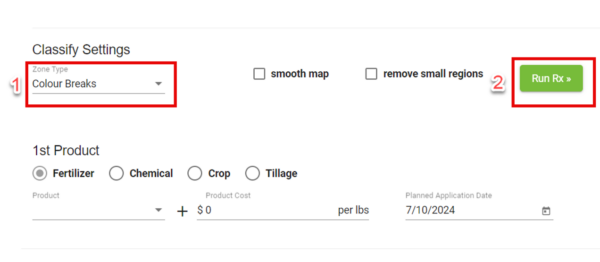
- In the new window, under the Classify Settings, change the Zone Type to “Colour Breaks”, then click Run Rx.
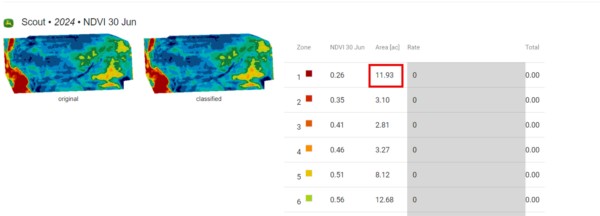
- You will now see an acres total for each of the Color Breaks on the map. You can repeat this quickly across all of your fields. If you close out the window here, it will not save the prescription.
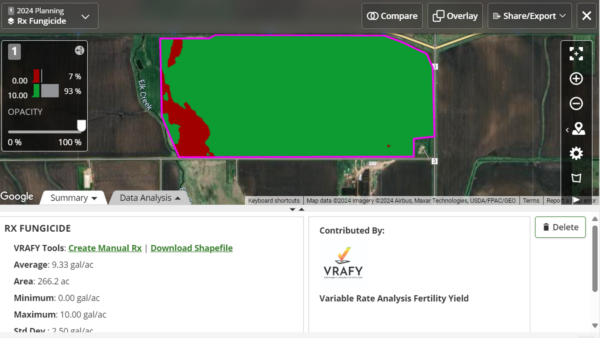
- As a bonus, you can save this as a prescription for later use if you add a Product and Rates. For example, if you want to skip fungicide applications where the crop has drowned out, set the lowest colored zone(s) to zero. Then set the rest to your standard rate. Press Save Shapefile at the bottom, and you will have just created a quick and easy variable rate Fungicide Map!
- Here is the view in the Operations Center of the previous map as a Fungicide Prescription. I set the water-damaged spots to zero and the rest to my standard rate of 10 GPA.
Using satellite imagery from VRAFY in the John Deere Operations Center makes it quick and easy to determine the extent of crop damage after a major event, like the recent flooding. If you have any questions, feel free to reach out to VRAFY support at 507-800-0898 or click here to schedule a meeting with one of our awesome team members!

