by bburgeson
Share

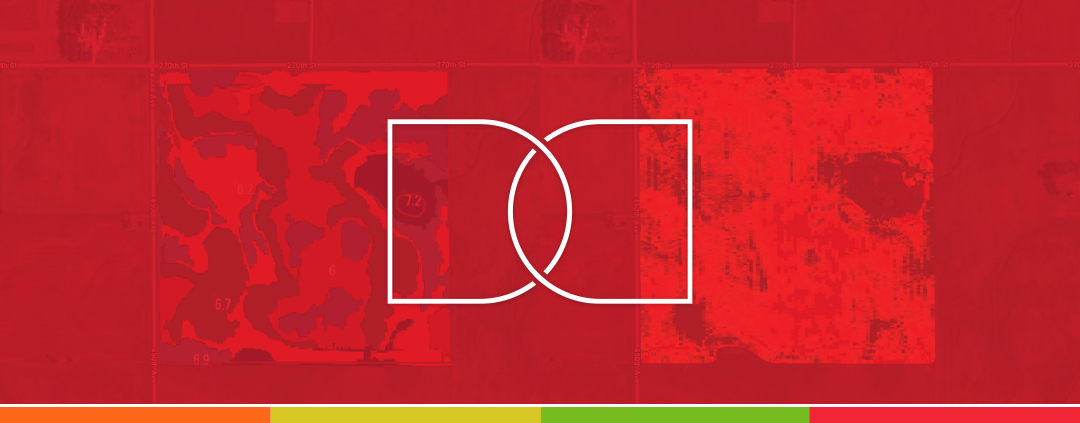
One of the benefits of having your data in the Operations Center is that it becomes easier to view the layers side by side. This allows you to see how the decisions you made throughout the year impacted the results on the yield map. It also allows you to see how the soil test results compare to the yield results in your field. You will see how easy it is to compare your yield map to your soil test results in a few steps.
For additional details for each step, check out our Knowledge Base.
- Start by bringing up a” Soil Test Results” layer within the Field Analyzer tool on the Operations Center website. This tool currently does not exist in the mobile app.If you do not have soil test results in your Operations Center, please contact VRAFY so we can discuss how to add them to your Operations Center Account.

- Next, click on the “Compare” button in the upper right.

- At this point, a second drop-down list will appear where you can choose your second layer. For example, we will compare the “Yield Layer” for Corn in 2023 against our soil sampling results.

- Once you view your layer, you can zoom in and out or move around the field, and both maps will stay coordinated. Our example shows that the soil K (Potassium) has been accumulating in the southern areas. Over the years, uniform application rates were used across the entire field. This practice inadvertently led to an excess buildup of potassium in this part of the field.

Comparing layers side by side is quite easy in the Operations Center and can help you visualize relationships between multiple factors and how they impact your yield.
If you do not have your soil test results or satellite imagery in the John Deere Operations Center, sign up with VRAFY today to get them added!

